 |
|
|
|
|
|
|
|
|
|
|
|
|
|
|
|
|
|
|
|
|
|
|
|
|
|
|
|
|
|
|
|
|
|
|
|
|
|
|
|
|
|
|
|
|
|
|
|
 |
| IFA ROE |
|
Home |
Overview |
Browser |
Access |
Login |
Cookbook |
|
Suggested SQL Queries for VVV Users
Contents
1. Introduction
In this document we provide a brief introduction to the use of the VISTA Science Archive (VSA) to do science in a step-by-step way with one particular survey, the VISTA Variables in Via Lactea. More general information about the VSA, SQL and other surveys is given in other pages on this site. The queries were developed for VVVDR4 and most will work on all releases.
VVV DR5 has important differences from previous releases.
This guide is currently being updated with queries that reflect the changes above. In many cases the
same queries will work, but anything with vvvSynopticSource or vvvSynopticMergeLog
must be amended.
2. Data Structure
2.1. Images and basic catalogues
Images are stored in the VSA as flat FITS files, with only the meta-data going into the SQL database. The VSA contains all the CASU generated images: reduced pawprint images (frameType='normal'), confidence images (frameType='conf'), stacked images made from a jitter combination of 'normal' frames (frameType='stack'), tiles made from six offset stacked pawprints (frameType='tilestack'), and additional deep images created by WFAU in Edinburgh, using the casutools software: (frameType='deepstack', 'deepstackconf', 'tiledeepstack' and 'tiledeepstackconf'). The frameType attribute can be found in the Multiframe table.
The images can be accessed through the Archive Listing, and cutouts can be created using Get Image and Multi-Get Image. The sky-coverage of the VVV and other surveys, including hosted surveys such as Glimpse, XMM3, WISE can be shown using in the Coverage Maps. It is necessary to download Aladin to view these maps, which use the Multi-Order Coverage (MOC) format.
Images and catalogues from CASU (and indeed WFAU generated deep images and catalogues) are created and stored as multi-extension FITS files, with each extension relating to a different VISTA detector in the case of pawprints, or with a single extension relating to the mosaiced image in the case of tiles. The image metadata and both the metadata and the table data from the catalogues are then ingested into the SQL data structure. The meta-data for each image is divided up amongst a set of tables for ease of use. Data from the primary header of each image FITS file, or parameters related to the whole multi-extension frame are stored in the table Multiframe and those relating to each extension are stored in MultiframeDetector except world-coordinate information and derived terms, which are in CurrentAstrometry. Each image is given a unique integer identifier (multiframeID), which can be used to track the frame through all the tables. The detector extensions are numbered using the extNum (values from 2 to 17).
Queries can be done on the these meta-data tables to find particular frames, e.g. Ks-band OB tile frames within 1 degree of the Galactic Centre observed between May 16th 2012 and June 20th 2012, with an airmass <1.2 and seeing <0.9".
Example 1
FROM Multiframe AS m,MultiframeDetector AS d, CurrentAstrometry AS c,ProgrammeFrame as p
WHERE p.programmeID=120 AND p.multiframeID=m.multiframeID AND m.multiframeID=d.multiframeID AND d.multiframeID=c.multiframeID AND d.extNum=c.extNum AND m.frameType='tilestack' AND dbo.fGreatCircleDist(c.l,c.b,0.,0.)<60. AND utDate BETWEEN '20120516' AND '20120620' AND m.filterID=5 AND (m.amStart+m.amEnd)/2.<1.2 AND d.seeing*c.xPixSize<0.9
The function fGreatCircleDist(ra1,dec1,ra2,dec2) returns an angular separation between two positions in arcminutes. This function can be used in many situations. Functions are given in the SchemaBrowser, but can be slow, so are best used on smaller tables, e.g. checking the separation between images rather than catalogues.
Another important meta-data table in Provenance, which links images to their components, e.g. a deep tile to the deep pawprint stacks, or a deep pawprint stack to observing block level (OB) pawprint stacks or an OB pawprint stack to the reduced images. Example 2 gets all of the OB pawprint component image names for a particular OB tile, and the third example gives the mean and stdev of the seeing for OB pawprint components of a deep tile and a comparison to the tile seeing.
Example 2
FROM Multiframe AS m,Provenance AS v
WHERE v.combiframeID=2449156 AND m.multiframeID=v.multiframeID
FROM MultiframeDetector AS d,Provenance AS v,Provenance as v1, CurrentAstrometry as c, MultiframeDetector as do,CurrentAstrometry as co
WHERE v.combiframeID=1000000017909 AND v.multiframeID=v1.combiframeID AND do.multiframeID=v1.multiframeID AND co.multiframeID=do.multiframeID AND co.extNum=do.extNum AND d.multiframeID=v.combiframeID AND d.multiframeID=c.multiframeID AND d.extNum=c.extNum
GROUP BY v.combiframeID,(d.seeing*c.xPixSize)
In this case we go down two layers of provenance. The first (v) links deep tiles to the deep pawprint stacks that are produced to create the tiles and then the second (v1) links the deep pawprint stacks to OB pawprint stacks. The combiframeIDs do change from release to release and the above example was from VVVDR4. An example from VVVDR5 would be e.g. v.combiframeID=1000000045293.
Each science frame, (frameType='stack','tilestack','deepstack','tiledeepstack') has an extracted catalogue, stored in vvvDetection, and each measurement can be identified by a combination of multiframeID, extNum and seqNum (the sequential number of the extraction of the particular detector). vvvDetection is an enormous table, with ~55 billion rows in VVVDR4, from 132612 frames. Each row in vvvDetection includes measured outputs from the CASU imcore extractor, including positions, 13 aperture fluxes, star-galaxy separation parameters, calibrated astrometry and calibrated photometry. Much of the data in tables such as vvvSource and vvvSynopticSource originates in vvvDetection, and the light-curves are created from vvvDetection, using links stored in vvvSourceXDetectionBestMatch.
Example 4 shows the connections between vvvSource and vvvDetection.
FROM vvvMergeLog as l,vvvSource as s,vvvDetection as d
WHERE l.frameSetID IN (SELECT MIN(frameSetID) FROM vvvMergeLog WHERE zmfID>0) AND l.frameSetID=s.frameSetID AND l.zmfID=d.multiframeID AND l.zeNum=d.extNum AND s.zseqNum=d.seqNum AND s.zAperMag3>13. AND s.zAperMag3<16.
In VVVDR5 and onwards, it is better to replace vvvDetection with vvvDetectionTiles, which includes just the tile detections, that the vvvSource table is produced from.
The vvvMergeLog links up the deepest frames in each band, which go into a single pointing and vvvSource contains the catalogue for each frameSet. This contains measurements such as zAperMag3 which is a direct copy of aperMag3 in vvvDetection for zmfID,zeNum,zseqNum, and derived quantities, such as the mean position, and colours.
The tile and pawprint detections are also linked in the VSA. vvvTilePawprints matches up the tile detections and pawprint detections from the 6 offsets. Each tile-pawprint set has its own tileSetID, and the input frames are described in vvvTileSet. The layout of vvvTilePawprints is similar to vvvSource, but no magnitudes or positions are given, simply links to match up the tables, so it is necessary to do joins with vvvDetection. Below are some examples of comparing the tile and pawprint attributes in a tile. The first example (Example 5) gives comparison between the tile aperMag3 and the average pawprint aperMag3 for regions where there are overlaps between offset1 and offset2 only and the tile multiframeID=. Example 6 shows the comparison for all regions where there are 6 overlaps for the same multiframeID. Later on, I will give examples of light curves using pawprint photometry.
Example 5.
FROM vvvTileSet AS t,vvvTilePawPrints AS p,vvvDetection AS do1, vvvDetection AS do2, vvvDetection AS dt
WHERE t.tlmfID=2449156 AND t.tileSetID=p.tileSetID AND (p.tlSeqNum>0 OR p.tileSetSeqNum<0) AND do1.multiframeID=t.o1mfID AND do1.extNum=p.o1ExtNum AND do1.seqNum=p.o1SeqNum AND do2.multiframeID=t.o2mfID AND do2.extNum=p.o2ExtNum AND do2.seqNum=p.o2SeqNum AND dt.multiframeID=t.tlmfID AND dt.extNum=p.tlExtNum AND dt.seqNum=p.tlSeqNum AND p.o1seqNum>0 AND p.o2seqNum>0
(p.tlSeqNum>0 OR p.tileSetSeqNum<0) returns a row for every tile detection, whether there are pawprint detections or not, and is very important if linking to tile based light-curves or similar situations. If you want to select only objects that are in pawprints offsetID=1 and offsetID=2, then add the additional constraint AND p.o3seqNum<0 AND p.o4seqNum<0 AND p.o5seqNum<0 AND p.o6seqNum<0
For VVVDR5, replace vvvDetection as do1 and vvvDetection as do2 with vvvDetectionPawprints as do1 and vvvDetectionPawprints as do2 and vvvDetection as dt with vvvDetectionTiles as dt.
Example 6.
FROM vvvTileSet AS t,vvvTilePawPrints AS p, vvvDetection AS dt, vvvDetection AS do1, vvvDetection AS do2, vvvDetection AS do3, vvvDetection AS do4, vvvDetection AS do5, vvvDetection AS do6
WHERE t.tlmfID=2449156 AND t.tileSetID=p.tileSetID AND dt.multiframeID=t.tlmfID AND dt.extNum=p.tlExtNum AND dt.seqNum=p.tlSeqNum AND do1.multiframeID=t.o1mfID AND do1.extNum=p.o1ExtNum AND do1.seqNum=p.o1SeqNum AND do2.multiframeID=t.o2mfID AND do2.extNum=p.o2ExtNum AND do2.seqNum=p.o2SeqNum AND do3.multiframeID=t.o3mfID AND do3.extNum=p.o3ExtNum AND do3.seqNum=p.o3SeqNum AND do4.multiframeID=t.o4mfID AND do4.extNum=p.o4ExtNum AND do4.seqNum=p.o4SeqNum AND do5.multiframeID=t.o5mfID AND do5.extNum=p.o5ExtNum AND do5.seqNum=p.o5SeqNum AND do6.multiframeID=t.o6mfID AND do6.extNum=p.o6ExtNum AND do6.seqNum=p.o6SeqNum AND p.o1seqNum>0 AND p.o2seqNum>0 AND p.o3seqNum>0 AND p.o4seqNum>0 AND p.o5seqNum>0 AND p.o6seqNum>0
For VVVDR5, replace vvvDetection as do1 and vvvDetection as do2 ... with vvvDetectionPawprints as do1 and vvvDetectionPawprints as do2 ... and vvvDetection as dt with vvvDetectionTiles as dt.
2.2. Stars
The vvvSource table is the central table in the WFAU data model, containing the master source list used for comparing to external surveys and for multi-epoch data. Thus it provides the best starting point to match the data to astrophysical sources. It provides a unique object list when the priOrSec flag is used to select primary sources. vvvSource are a set of band-merged catalogues from each pointing (frameSet) extracted from the deepest frames in each band. Where there is overlap, between sets of frames, the more complete source in terms of bands measured and the one with fewest qualit bit flags set will be selected as primary, and all the others as secondary. Selecting primary sources only gives us a master catalogue. vvvSource<\i> is used as the starting point for multi-epoch merging and for matching to external surveys. Below are some examples using vvvSource<\i> for selecting stars, matching to external catalogues. We will demonstrate light-curve selection and use of extinction maps in a later section.
Example 7, shows a selection on the vvvSource table, selecting positional, colour and magnitude data for a seamless sample selected in a Galactic longitude and latitude range, having detections in the Z-band and Ks-band and a Ks-band brightness <18 mag.
FROM vvvSource
WHERE ksAperMag1>0. AND ksAperMag3<18. AND zAperMag3>0. AND (priOrSec=0 OR priOrSec=frameSetID) AND l BETWEEN 340. AND 345. AND b BETWEEN -0.5 AND 0.5
FROM vvvSource AS s,GLIMPSE..glimpse2_hrc AS gl,vvvSourceXglimpse2_hrc AS x
WHERE ksAperMag1>0. AND ksAperMag3<18. AND zAperMag3>0. AND (priOrSec=0 OR priOrSec=frameSetID) AND s.l BETWEEN 340. AND 345. AND s.b BETWEEN -0.5 AND 0.5 AND s.sourceID=x.masterObjID AND x.slaveObjID=gl.seqNo AND distanceMins<0.08 AND distanceMins IN (select MIN(distanceMins) from vvvSourceXglimpse1_hrc where masterObjID=x.masterObjID) AND gl.mag3_6<20. AND gl.mag4_5<20.
The distanceMins<0.08 AND distanceMins IN (select MIN(distanceMins) from vvvSourceXglimpse2_hrc where masterObjID=x.masterObjID) constraint selects the nearest Glimpse 1 match, as long as it is within 0.08 arcmin (~5 arcsec). However, only VVV sources which have a Glimpse match that match all the constraints will return rows. If you want all the VVV sources that match the VVV constraints, with Glimpse photometry for those with Glimpse detections above, and default values for those without Glimpse detections, then you can use the UNION command to join queries, see Example 9.
Example 9.
FROM vvvSource AS s,GLIMPSE..glimpse1_hrc AS gl, vvvSourceXglimpse1_hrc AS x
WHERE s.ksAperMag3>0. AND s.ksAperMag3<18. AND s.zAperMag3>0. AND (s.priOrSec=0 OR s.priOrSec=frameSetID) AND s.l BETWEEN 340. AND 345. AND s.b BETWEEN -0.5 AND 0.5 AND s.sourceID=x.masterObjID AND x.slaveObjID=gl.seqNo AND distanceMins<0.08 AND distanceMins IN (select MIN(distanceMins) from vvvSourceXglimpse1_hrc where masterObjID=x.masterObjID) AND gl.mag3_6<20. AND gl.mag4_5<20.
UNION
SELECT s.l, s.b, s.ra, s.dec, s.zmyPnt, s.zmyPntErr, s.ymjPnt, s.ymjPntErr, s.ksAperMag3, s.ksAperMag3Err,-9.999995e8,-9.999995e8,-9.999995e8, -9.999995e8, s.mergedClass,distanceMins
FROM vvvSource AS s,GLIMPSE..glimpse1_hrc AS gl, vvvSourceXglimpse1_hrc AS x
WHERE s.ksAperMag3>0. AND s.ksAperMag3<18. AND s.zAperMag3>0. AND (s.priOrSec=0 OR s.priOrSec=frameSetID) AND s.l BETWEEN 340. AND 345. AND s.b BETWEEN -0.5 AND 0.5 AND s.sourceID=x.masterObjID AND x.slaveObjID=gl.seqNo AND distanceMins<0.08 AND distanceMins IN (select MIN(distanceMins) from vvvSourceXglimpse1_hrc where masterObjID=x.masterObjID) AND (gl.mag3_6>=20. OR gl.mag4_5>=20.)
UNION
SELECT s.l, s.b, s.ra, s.dec, s.zmyPnt, s.zmyPntErr, s.ymjPnt, s.ymjPntErr, s.ksAperMag3, s.ksAperMag3Err,-9.999995e8,-9.999995e8,-9.999995e8, -9.999995e8, s.mergedClass,-9.999995e8
FROM vvvSource AS s, vvvSourceXglimpse1_hrc AS x
WHERE s.ksAperMag3>0. AND s.ksAperMag3<18. AND s.zAperMag3>0. AND (s.priOrSec=0 OR s.priOrSec=frameSetID) AND s.l BETWEEN 340. AND 345. AND s.b BETWEEN -0.5 AND 0.5 AND s.sourceID=x.masterObjID AND distanceMins>=0.08 AND distanceMins IN (select MIN(distanceMins) from vvvSourceXglimpse1_hrc where masterObjID=x.masterObjID)
UNION
SELECT s.l, s.b, s.ra, s.dec, s.zmyPnt, s.zmyPntErr, s.ymjPnt, s.ymjPntErr, s.ksAperMag3, s.ksAperMag3Err,-9.999995e8,-9.999995e8,-9.999995e8, -9.999995e8, s.mergedClass,-9.999995e8
FROM vvvSource AS s
WHERE s.ksAperMag3>0. AND s.ksAperMag3<18. AND s.zAperMag3>0. AND (s.priOrSec=0 OR s.priOrSec=frameSetID) AND s.l BETWEEN 340. AND 345. AND s.b BETWEEN -0.5 AND 0.5 AND s.sourceID NOT IN (select masterObjID from vvvSourceXglimpse1_hrc)
In this example there are 4 separate queries, which each return the same parameters, joined via a UNION. The first query is identical to example 8, except with the additional parameter distanceMins in the select string. This returns 677180 rows when run on VVVDR4. The second query returns VVV sources where there are VVV-Glimpse matches, but where one or both of the Glimpse 3.6/4.5 micron fluxes are greater than 20 mag. This returns 13341 rows when run on VVVDR4. The 3rd query returns VVV photometry for VVV sources where there is a Glimpse source in the neighbour table, but further than 0.08 arcmin (returning 24659 rows in VVVDR4), and the 4th query returns VVV photometry for VVV sources which meet the VVV criteria, and have no matches to any Glimpse-1 source (returning 236768 rows). Thus the whole query returns 951948 rows in VVVDR4.
The vvvSource table is also the usual table for matching to your own catalogues through CrossID or doing cone searches using Region.
The CrossID service can be used to select the nearest object within a particular radius or all matches within that radius, much like the neighbour tables, but more flexible, although the queries will take longer and there is an upper limit of 50000 objects. Example 10 shows a crossID query using a simple input catalogue, which is a 3x6 grid around the Galactic Centre, see Galactic Centre Grid coordinates.
Example 10:
Leave the constraints as '(priOrSec<=0 OR priOrSec=frameSetID)'. This selects primary sources only.
Leave the attributes to select as 'default'. As long as sourceID,ra,dec are in the attributes, it is useful for for future queries.
Set the pairing radius to '2.0' arcsec. For the VVV, keep this small.
Set the pairing option to 'Nearest object only'.
Browse for the file of coordinates 'vvvCrossIDCoords.txt'.
Set data format to preferred type. FITS or VoTable have the advantage of preserving the attribute names, which makes further queries more straightforward.
The input file in this case has 18 rows, and therefore the crossID match returns 18 rows, but only 12 are matched to vvvSources.
2.3. Colours
In the VVV we have two tables of band-merged data: vvvSource and vvvSynopticSource. vvvSource contains colours from the deepest images in each pointing and vvvSynopticSource from contemporary colours. For non-variable sources, the colours from the deepest images will be best because of lower signal-to-noise, but for variables, the contemporary colours give a better indication. The first epoch of ZYJHKs frames were split into 2 OBs (ZY) and (JHKs). The Ks frame in vvvSynopticSource is usually from the JHKs OB. When this is not possible - the Ks frame was deprecated, or the OB was incomplete, we choose the Ks-frame with 80s integration time, and failing the Ks frame that is closest to the mean mjdObs of the J and H frames. vvvSourceXSynopticSource links the two tables. In the future (VVVDR5+) we will just have a single table vvvSource which will have both the deepest measurements and contemporary measurements, having the following set of bandpasses: Z,Y,J,H,Ks,Ks_1, where Ks would be the deep Ks band, and Ks_1 would be the contemporary colour epoch. In future VVV / VVVX releases where there may be additional multi-colour epochs, e.g. a second JHKs OB, then the bandpasses would be: Z,Y,J,J_1,J_2,H,H_1,H_2,Ks,Ks_1,Ks_2, again where J,H,Ks are the objects from the deep images, and X_1 are the first multi-band epoch and X_2 are the second multi-band epoch.
One issue to be aware of is that to use the contemporary colours with other data, such as variability data or external data, it is necessary to join to the vvvSource table, since all the links in the data model are through this table. Some examples are shown below, which will demonstrate important aspects of the joins and selecting for different requirements.
A parameter "mergeDuration" has been added into "SynopticMergeLog" table so that users can select only those pointings when all 5 bands were taken contemporarily.To select data with contempory colours in the VVV, with an ID from the main vvvSource table (for joining to other tables (e.g. vvvVariability, or external surveys), as shown in Example 11:
Example 11.
FROM vvvSource AS s,vvvSourceXSynopticSource AS x, vvvSynopticSource AS ss, (SELECT l.frameSetID,sl.synFrameSetID, sl.meanMjdObs,sl.mergeDuration FROM vvvSynopticMergeLog AS sl, vvvMergeLog AS l WHERE dbo.fGreatCircleDist(l.ra,l.dec,sl.ra,sl.dec)<1) AS ML
WHERE (s.priOrSec=0 OR s.priOrSec=s.frameSetID) AND x.masterObjID=s.sourceID AND x.distanceMins<0.033 AND x.distanceMins IN (SELECT MIN(distanceMins) FROM vvvSourceXSynopticSource WHERE masterObjID=x.masterObjID) AND ss.synopticID=x.slaveObjID AND ML.frameSetID=s.frameSetID AND ML.synFrameSetID=ss.synFrameSetID
The query within the FROM string creates a temporary match between the vvvMergeLog (list of frame sets used to create vvvSource) and vvvSynopticMergeLog (list of frame sets used to create vvvSynopticSource), within 1 arcminute, so that repeated matches in overlap regions aren't returned. If you prefer all the overlapping contemporary colours, exclude this and all parts of the query with the ML alias. The next query (Example 12) adds in a selection for only the frames where contemporary colours were taken within a day (mergeDuration<1.)
For VVVDR5, this selection can be done on a single table, but we no longer have the \ mergeDuration term, and we have two epochs. Selecting contemporary colours from epoch 1:
FROM vvvSource AS s
Example 12.
FROM vvvSource AS s,vvvSourceXSynopticSource AS x, vvvSynopticSource AS ss, (SELECT l.frameSetID,sl.synFrameSetID, sl.meanMjdObs,sl.mergeDuration FROM vvvSynopticMergeLog AS sl, vvvMergeLog AS l WHERE dbo.fGreatCircleDist(l.ra,l.dec,sl.ra,sl.dec)<1 AND mergeDuration<1.) AS ML
WHERE (s.priOrSec=0 OR s.priOrSec=s.frameSetID) AND x.masterObjID=s.sourceID AND x.distanceMins<0.033 AND x.distanceMins IN (SELECT MIN(distanceMins) FROM vvvSourceXSynopticSource WHERE masterObjID=x.masterObjID) AND ss.synopticID=x.slaveObjID AND ML.frameSetID=s.frameSetID AND ML.synFrameSetID=ss.synFrameSetID
FROM vvvSource AS s,(SELECT l.frameSetID FROM vvvMergeLog as l,Multiframe as zm, Multiframe as ym,Multiframe as jm,Multiframe as hm,Multiframe as ksm WHERE l.z_1mfID=zm.multiframeID AND l.y_1mfID=ym.multiframeID AND l.j_1mfID=jm.multiframeID AND l.h_1mfID=hm.multiframeID AND l.ks_1mfID=ksm.multiframeID AND ((zm.mjdObs>0 AND ym.mjdObs>0 AND ABS(zm.mjdObs-ym.mjdObs)<1) AND (ym.mjdObs>0 AND jm.mjdObs>0 AND ABS(ym.mjdObs-jm.mjdObs)<1) AND (jm.mjdObs>0 AND hm.mjdObs>0 AND ABS(jm.mjdObs-hm.mjdObs)<1) AND (hm.mjdObs>0 AND ksm.mjdObs>0 AND ABS(hm.mjdObs-ksm.mjdObs)<1))) as ml
WHERE ml.frameSetID=s.frameSetID
2.4. Multi-epoch data
The individual OB measurements for each object are stored in vvvDetection. These vvvSourceXDetectionBestMatch table links up OB tile detections for the same source, and statistics calculated from the light-curve of these tile detections for each source are stored in vvvVariability. Use of these tables allows you to select variables, and get the light-curve data. To select very red transient objects, for instance, like WIT-001 (ATEL 4041), combine a colour selection with a selection from vvvVariability which gives statistics on the tile light-curves. Example 13, selects sources that have a Ks band RMS > 2 magnitudes, at least 4 good observations and a mean magnitude between 0 and 18., removing the very faintest sources.Example 13
FROM vvvSource AS s,vvvSourceXSynopticSource AS x, vvvSynopticSource AS ss, vvvVariability as v, (SELECT l.frameSetID,sl.synFrameSetID, sl.meanMjdObs,sl.mergeDuration FROM vvvSynopticMergeLog AS sl, vvvMergeLog AS l WHERE dbo.fGreatCircleDist(l.ra,l.dec,sl.ra,sl.dec)<1) AS ML
WHERE (s.priOrSec=0 OR s.priOrSec=s.frameSetID) AND x.masterObjID=s.sourceID AND x.distanceMins<0.033 AND x.distanceMins IN (SELECT MIN(distanceMins) FROM vvvSourceXSynopticSource WHERE masterObjID=x.masterObjID) AND ss.synopticID=x.slaveObjID AND ML.frameSetID=s.frameSetID AND ML.synFrameSetID=ss.synFrameSetID and ss.hmksPnt>2. and v.sourceID=s.sourceID and v.ksMagRms>2. and v.ksMeanMag>0. and v.ksMeanMag<18. and v.ksnGoodObs>4
In VVVDR5, this selection can be simplified, using the selection of colours in epoch 1 and sped up using vvvDetectionPawprints
FROM vvvSource AS s, vvvVariability as v
WHERE (s.priOrSec=0 OR s.priOrSec=s.frameSetID) AND s.h_1mks_1Pnt>2. and v.sourceID=s.sourceID and v.ksMagRms>2. and v.ksMeanMag>0. and v.ksMeanMag<18. and v.ksnGoodObs>4
2, replace s.h_1mks_1Pnt>2. with (s.h_1mks_1Pnt>2. OR s.h_2mks_2Pnt>2.)
The light-curves of the sources found in Example 13 can be found using Example 14. This takes the Example 13 query and links up to the vvvDetection table, using vvvSourceXDetectionBestMatch, which links unique astrophysical sources in the vvvSource table to each measurement. In this example, every OB tile measurement is returned, regardless of filter, so the filterID is added to the parameters returned. The mjdObs is the starting observation time of the tile image. The ppErrBits attribute gives the post-processing flags in a single bit-wise number.
Example 14
FROM vvvSource AS s,vvvSourceXSynopticSource AS x, vvvSynopticSource AS ss, vvvVariability as v, (SELECT l.frameSetID,sl.synFrameSetID, sl.meanMjdObs, sl.mergeDuration FROM vvvSynopticMergeLog AS sl, vvvMergeLog AS l WHERE dbo.fGreatCircleDist(l.ra,l.dec,sl.ra,sl.dec)<1) AS ML, vvvSourceXDetectionBestMatch as b,Multiframe as m,vvvDetection as d
WHERE (s.priOrSec=0 OR s.priOrSec=s.frameSetID) AND x.masterObjID=s.sourceID AND x.distanceMins<0.033 AND x.distanceMins IN (SELECT MIN(distanceMins) FROM vvvSourceXSynopticSource WHERE masterObjID=x.masterObjID) AND ss.synopticID=x.slaveObjID AND ML.frameSetID=s.frameSetID AND ML.synFrameSetID=ss.synFrameSetID AND ss.hmksPnt>2. AND v.sourceID=s.sourceID AND v.ksMagRms>2. AND v.ksMeanMag>0. AND v.ksMeanMag<18. AND v.ksnGoodObs>4 AND b.sourceID=s.sourceID AND b.multiframeID=m.multiframeID AND b.multiframeID=d.multiframeID AND b.extNum=d.extNum AND b.seqNum=d.seqNum
In VVVDR5, this is much simpler:
FROM vvvSource AS s,vvvVariability as v,
vvvSourceXDetectionBestMatch as b,Multiframe as m,vvvDetectionPawprints as d
WHERE (s.priOrSec=0 OR s.priOrSec=s.frameSetID) AND (s.h_1mks_1Pnt>2. OR s.h_2mks_2Pnt>2.)
AND v.sourceID=s.sourceID AND v.ksMagRms>2. AND v.ksMeanMag>0. AND v.ksMeanMag<18. AND
v.ksnGoodObs>4 AND b.sourceID=s.sourceID AND b.multiframeID=m.multiframeID AND
b.multiframeID=d.multiframeID AND b.extNum=d.extNum AND b.seqNum=d.seqNum
FROM (SELECT s.sourceID FROM vvvSource AS s, vvvVariability AS v WHERE s.sourceID=v.sourceID AND s.zmyPnt>1. AND v.ksnGoodObs>40 AND (v.ksMaxMag-v.ksMinMag)>2. AND v.ksMinMag>0. AND v.ksMeanMag>13. AND v.ksMeanMag<16.5 AND v.ksSkewness>1.0 AND ABS(s.b)>1.5) AS cat, vvvSourceXDetectionBestMatch AS b, vvvTileSet AS t,vvvTilePawPrints AS p,vvvDetection AS do1,vvvDetection AS do2, vvvDetection AS do3,vvvDetection AS do4, vvvDetection AS do5, vvvDetection AS do6, Multiframe AS m
WHERE cat.sourceID=b.sourceID AND b.multiframeID=t.tlmfID AND t.tileSetID=p.tileSetID AND b.extNum=p.tlExtNum AND b.seqNum=p.tlSeqNum AND (p.tlSeqNum>0 OR p.tileSetSeqNum<0) AND do1.multiframeID=t.o1mfID AND do1.extNum=p.o1ExtNum AND do1.seqNum=p.o1SeqNum AND do2.multiframeID=t.o2mfID AND do2.extNum=p.o2ExtNum AND do2.seqNum=p.o2SeqNum AND do3.multiframeID=t.o3mfID AND do3.extNum=p.o3ExtNum AND do3.seqNum=p.o3SeqNum AND do4.multiframeID=t.o4mfID AND do4.extNum=p.o4ExtNum AND do4.seqNum=p.o4SeqNum AND do5.multiframeID=t.o5mfID AND do5.extNum=p.o5ExtNum AND do5.seqNum=p.o5SeqNum AND do6.multiframeID=t.o6mfID AND do6.extNum=p.o6ExtNum AND do6.seqNum=p.o6SeqNum AND m.multiframeID=b.multiframeID AND m.filterID=5
Example 16. The same as example 15, but with all the vvvDetection instances replaced by temporary tables including only the rows corresponding to that offset, using offsetID in Multiframe and only the attributes required. This gives a significant improvement in performance.
FROM (select s.sourceID from vvvSource as s, vvvVariability as v where s.sourceID=v.sourceID AND s.zmyPnt>1. AND v.ksnGoodObs>40 AND (v.ksMaxMag-v.ksMinMag)>0.6 AND v.ksMinMag>0. AND v.ksMeanMag>13. AND v.ksMeanMag<16.7 AND v.ksSkewness>0.7 AND abs(s.b)>1.2) as cat, vvvSourceXDetectionBestMatch as b, vvvTileSet as t,vvvTilePawPrints as p, (select d.multiframeID,d.extNum,d.seqNum,d.aperMag3,d.aperMag3Err, d.ppErrBits FROM vvvDetection as d,Multiframe as m where m.multiframeID=d.multiframeID AND m.offSetID=1) as do1, (select d.multiframeID,d.extNum,d.seqNum,d.aperMag3,d.aperMag3Err, d.ppErrBits FROM vvvDetection as d,Multiframe as m where m.multiframeID=d.multiframeID AND m.offSetID=2) as do2, (select d.multiframeID,d.extNum,d.seqNum,d.aperMag3,d.aperMag3Err, d.ppErrBits FROM vvvDetection as d,Multiframe as m where m.multiframeID=d.multiframeID AND m.offSetID=3) as do3, (select d.multiframeID,d.extNum,d.seqNum,d.aperMag3,d.aperMag3Err, d.ppErrBits FROM vvvDetection as d,Multiframe as m where m.multiframeID=d.multiframeID AND m.offSetID=4) as do4, (select d.multiframeID,d.extNum,d.seqNum,d.aperMag3,d.aperMag3Err, d.ppErrBits FROM vvvDetection as d,Multiframe as m where m.multiframeID=d.multiframeID AND m.offSetID=5) as do5, (select d.multiframeID,d.extNum,d.seqNum,d.aperMag3,d.aperMag3Err, d.ppErrBits FROM vvvDetection as d,Multiframe as m where m.multiframeID=d.multiframeID AND m.offSetID=6) as do6,Multiframe as mt
WHERE cat.sourceID=b.sourceID AND b.multiframeID=t.tlmfID AND t.tileSetID=p.tileSetID AND b.extNum=p.tlExtNum AND b.seqNum=p.tlSeqNum AND (p.tlSeqNum>0 OR p.tileSetSeqNum<0) AND do1.multiframeID=t.o1mfID AND do1.extNum=p.o1ExtNum AND do1.seqNum=p.o1SeqNum AND do2.multiframeID=t.o2mfID AND do2.extNum=p.o2ExtNum AND do2.seqNum=p.o2SeqNum AND do3.multiframeID=t.o3mfID AND do3.extNum=p.o3ExtNum AND do3.seqNum=p.o3SeqNum AND do4.multiframeID=t.o4mfID AND do4.extNum=p.o4ExtNum AND do4.seqNum=p.o4SeqNum AND do5.multiframeID=t.o5mfID AND do5.extNum=p.o5ExtNum AND do5.seqNum=p.o5SeqNum AND do6.multiframeID=t.o6mfID AND do6.extNum=p.o6ExtNum AND do6.seqNum=p.o6SeqNum AND mt.multiframeID=b.multiframeID AND mt.filterID=5
The above examples are not necessary in VVVDR5, in which the pawprint light-curves are already returned.
Selections can be designed using the colour and variability properties to select samples of variable stars. The following example (Example 17) uses contemporary colours (using Example 11) and selects objects that have at least 40 Ks epochs, a Ks rms between 0.2 and 0.5, a slightly skewed light-curve, and contemporary colour selections in Z-Y, J-H and H-Ks as well as Ks magnitude range, returning 23239 sources.
Example 17: Selecting variables based on colour and variability.
FROM vvvVariability as v,vvvSource AS s,vvvSourceXSynopticSource AS x, vvvSynopticSource AS ss, (SELECT l.frameSetID,sl.synFrameSetID, sl.meanMjdObs,sl.mergeDuration FROM vvvSynopticMergeLog AS sl, vvvMergeLog AS l WHERE dbo.fGreatCircleDist(l.ra,l.dec,sl.ra,sl.dec)<1) AS ML
WHERE (s.priOrSec=0 OR s.priOrSec=s.frameSetID) AND x.masterObjID=s.sourceID AND x.distanceMins<0.033 AND x.distanceMins IN (SELECT MIN(distanceMins) FROM vvvSourceXSynopticSource WHERE masterObjID=x.masterObjID) AND ss.synopticID=x.slaveObjID AND ML.frameSetID=s.frameSetID AND ML.synFrameSetID=ss.synFrameSetID AND s.sourceID=v.sourceID AND v.ksnGoodObs>=40 AND v.ksMagRms BETWEEN 0.2 AND 0.5 AND v.ksMeanMag BETWEEN 13. AND 16.5 AND v.ksSkewness BETWEEN 0.5 AND 1.5 AND ss.hmksPnt BETWEEN -0.5 AND 2. AND ss.jmhPnt BETWEEN 0.5 AND 3.0 AND ss.zmyPnt BETWEEN -0.2 AND 3.7 AND v.variableClass=1
2.5 3D Extinction Maps
We have started incorporating 3D Extinction Maps into the WFAU Archives. We have described the details behind the database design here.. We incorporate the maps into two tables, a pixel map and an extinction as a function of pixel and distance. We also include a table of extinction coefficients for a range of passbands and extinction laws, matching tables to overlapping source tables and a function to do efficient matches for other data. All 3D extinction maps are stored in the EXTINCT database (see the SchemaBrowser). Below we give a few basic examples: Example 18: Ks-band extinction corrected magnitude for a particular VVV source (in the bulge) at a distance of 5kpc. The VVV is linked to a 3D map of the bulge (Chen et al. 2013, ) which is mapID=2 in the EXTINCT..ThreeDimExtinctionMaps table.
FROM vvvSource AS s, vvvSourceExtinction AS c, (SELECT e.*, (e.ejks*fks.aEJKsCard) AS aKsCard FROM EXTINCT..vvvBulge3DExtinctVals AS e, EXTINCT..FilterExtinctionCoefficients AS fks
WHERE fks.filterID=9) AS Ext WHERE s.sourceID=515488609610 AND s.sourceID=c.sourceID AND Ext.pixelID=c.extPixelID AND c.extMapID=2 AND Ext.r=5.
Example 19 selects a large sample of objects to produce an absolute colour magnitude diagram:
FROM vvvSourceExtinction AS c, vvvSource AS s, (select pixelID,(r+0.005) AS corR,ejks,ejksErr, (ejks*fz.aEJKsCard) AS aZ, (ejksErr*fz.aEJKsCard) AS aZErr, (ejks*fy.aEJKsCard) AS aY, (ejksErr*fy.aEJKsCard) AS aYErr, (ejks*fj.aEJKsCard) AS aJ, (ejksErr*fj.aEJKsCard) AS aJErr, (ejks*fh.aEJKsCard) AS aH, (ejksErr*fh.aEJKsCard) AS aHErr, (ejks*fks.aEJKsCard) AS aKs, (ejksErr*fks.aEJKsCard) AS aKsErr from EXTINCT..vvvBulge3DExtinctVals AS e, EXTINCT..FilterExtinctionCoefficients AS fz, EXTINCT..FilterExtinctionCoefficients AS fy, EXTINCT..FilterExtinctionCoefficients AS fj, EXTINCT..FilterExtinctionCoefficients AS fh, EXTINCT..FilterExtinctionCoefficients AS fks where fz.filterID=5 and fy.filterID=6 and fj.filterID = 7 and fh.filterID=8 and fks.filterID=9) AS Ext
WHERE c.extPixelid=Ext.pixelid AND c.sourceID=s.sourceID AND c.extMapID=2 AND s.jAperMag3<16. AND yAperMag3>0. AND jAperMag3>0. AND Ext.corR>0.25 AND s.l<2. AND abs(s.b)<1.
More complex selections can be made with all the other VVV tables and link to the 3D maps through vvvSourceExtinction.
If you want to get extinction values for a different survey, or a random position, we have a function fgetPixelID(ra,dec) that can be used efficiently for a few thousand objects. fgetPixelID should be used with the CROSS APPLY function, using table CROSS APPLY EXTINCT.dbo.fgetPixelID(ra,dec). This can be done with any table that contains right-ascension and declination values.
The following example (Example 20) gives the extinction corrected spectral energy distribution for a star as a function of distance in VVV and Glimpse bands:
FROM vvvSource AS s CROSS APPLY EXTINCT.dbo.fgetPixelID(ra,dec) AS c, (SELECT e.*, (e.ejks*fz.aEJKsCard) AS aZCard, (e.ejks*fy.aEJKsCard) AS aYCard, (e.ejks*fj.aEJKsCard) AS aJCard, (e.ejks*fh.aEJKsCard) AS aHCard, (e.ejks*fks.aEJKsCard) AS aKsCard, (e.ejks*f34.aEJKsCard) AS a34Card, (e.ejks*f45.aEJKsCard) AS a45Card, (e.ejks*f58.aEJKsCard) AS a58Card, (e.ejks*f80.aEJKsCard) AS a80Card FROM EXTINCT..vvvBulge3DExtinctVals AS e, EXTINCT..FilterExtinctionCoefficients AS fz, EXTINCT..FilterExtinctionCoefficients AS fy, EXTINCT..FilterExtinctionCoefficients AS fj, EXTINCT..FilterExtinctionCoefficients AS fh, EXTINCT..FilterExtinctionCoefficients AS fks, EXTINCT..FilterExtinctionCoefficients AS f34, EXTINCT..FilterExtinctionCoefficients AS f45, EXTINCT..FilterExtinctionCoefficients AS f58, EXTINCT..FilterExtinctionCoefficients AS f80 WHERE fz.filterID=5 AND fy.filterID=6 AND fj.filterID=7 AND fh.filterID=8 AND fks.filterID=9 AND f34.filterID=20 AND f45.filterID=21 AND f58.filterID=22 AND f80.filterID=23) AS Ext, GLIMPSE..glimpse_hrc_inter AS g
WHERE s.sourceID=515488609610 AND g.seqNo=406 AND Ext.pixelID=c.pixelID AND Ext.r>5.
2.6 Non-pipeline team (Value Added Product, VAP) catalogues
We have imported catalogues generated by the VVV team, such as PSF catalogues. These are linked to other data via the frame links, and in the future will have additional links via neighbour tables to other public surveys and perhaps to other VVV too.Currently we have two main VVV PSF catalogues, both generated from multi-band data from one epoch or the average of two epochs, and released as a source like table. Both also use a similar table structure to vvvSource, having links to the frames that they are derived from in a table like vvvMergeLog. We also have proper motion and parallax catalogues. Neighbour tables link all of these catalogues to vvvSource and also link tables with multiple entries for each vvvSource entry, i.e. the PSF catalogues to the external catalogues.
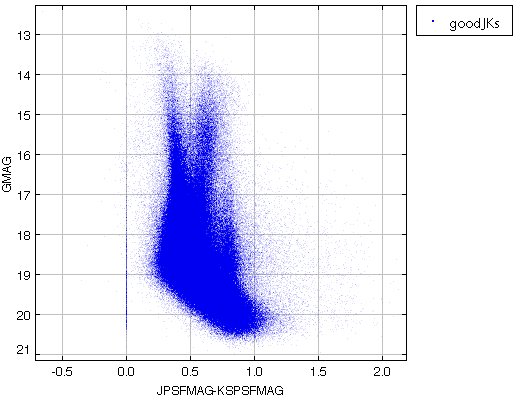
The following example (Example 21) selects data from the Dophot, 2 epoch ZYJHKs PSF catalogue, matched to the main Gaia catalogue in one field
WHERE l.frameSetID=psf.frameSetID and l.fieldName='b201' and psf.psfID=x.masterObjID and x.slaveObjID=gaia.source_ID and x.distanceMins<0.03 and x.distanceMins in (select min(distanceMins) from vvvPsfDoPhotZYJHKsSourceXgaia_source where x.masterObjID=masterObjID) and jPsfMag>0. and ksPsfMag>0.
This selection can be used to produce the colour-magnitude diagram below:
2.7 VIVA variable star catalogue
Introduction
The VIVA catalogue (Ferreira-Lopes et al. 2020, MNRAS, 496, 1730, https://ui.adsabs.harvard.edu/abs/2020arXiv200505404F/abstract) includes indices, statistics and periods for 45 million variable star candidates vvvVivaCatalogue and a second table vvvVivaXMatchCatalogue that has cross-matches to 241,557 sources in the literature. We give some examples of using the catalogue by itself and with other VVV data. It is derived from VVVDR4 and so the VIVA vivaID match the VVVDR4 sourceID. Using it with other releases will \ require additional steps, see below.
Completeness versus reliability
The catalogue is selected to have a high-completeness, but contains correlations indices and robust statistics that make it possible for users to select more reliable samples, so each scientist can tune the degree of completeness versus reliability for their science.
Users can select only correlated data (flagDataType='CCD'), i.e. data where there are pairs of measurements at each epoch that can be correlated to produce an index. Noise generally has different values of this index than longer term variability. The variability candidates are selected from the wider set of VVV sources using indices such as Kfi2 (the flux-independent correlation index), and fapCorrelation2 (the false alarm probability for Kfi2) for correlated data and Xindex (the ratio of the measured noise to the expected noise for a source of that magnitude). Users can also select for Xindex used in both correlated and non-correlated data.
Users can also look at the number of good measurements, and the period finding statistics, e.g. the period power-spectrum heights (e.g. heightLSG) which give an indication of the reliability of a period and various flags, such as flagNfreq which tells the user how many methods found the most likely frequency. The flagFbias6/7 flags indicate how many objects in the tile have a matching frequency within 1e-6 days or 1e-7 days. Larger numbers often occur around natural periods such as days, years, or harmonics of these, but can also do so on other periods, that are tile dependent, possibly to do with the time between observations in that pointing.
Selecting a more reliable sample, see Section 4.4. The selection below, increases the reliability by selecting objects where the rms of the light-curve is at least twice the expected noise (Xindex>2.), there are at least 30 measurements, at least two different period finding methods find the bestPeriod (implicitly implies that a period is measurable), that there are no more than 2 objects with a frequency within 2e-6 (misses true objects with periods close to natural ones, but removes many spurious), and finally the power in the correlation period method is greater than the expected noise value for this method.
FROM vvvVivaCatalogue
WHERE Xindex>2. AND nGoodMeasurements>30 AND flagNfreq>=2 AND flagFbias6<=2 AND (heightPKfi2/FAPcorrelation2)>1.0
Selecting on variability properties
Selecting sources using period and amplitude:
FROM vvvVivaCatalogue
WHERE bestPeriod BETWEEN 2. AND 10. AND Avar BETWEEN 0.5 AND 1.0
This selection can be enhanced using the basic statistics in vvvVariability. For instance, increasing the number of good measurements to be at least 100 and then selecting objects where the ratio of the medium magnitude minus the minimum magnitude (brightest) to the maximum minus the minimum in cases where the minimum is not default, and there is a cross-match in the literature (using the vvvVivaXmatchCatalogue table) i.e.
FROM vvvVivaCatalogue as viva,vvvVariability as v,vvvVivaXMatchCatalogue as vxm
WHERE v.sourceID=viva.vivaID AND bestPeriod BETWEEN 2. AND 10. AND Avar BETWEEN 0.5 AND 1.0 AND viva.nGoodMeasurements>=100 AND (v.ksmedianMag-v.ksMinMag)/(v.ksMaxMag-v.ksMinMag)<0.2 AND v.ksMinMag>0. AND vxm.vivaID=viva.vivaID
Returns 592 EB eclipsing binaries, 14 EA eclipsing binaries, 28 other eclipsing binaries and 6 other variables, i.e. >99% of the sample are eclipsing binaries. Applying this selection to the whole VIVA catalogue returns 2200 objects, which will probably be a highly reliable, but incomplete sample of eclipsing binaries.
WHERE b.sourceID=sel.sourceID AND b.multiframeID=m.multiframeID AND b.multiframeID=d.multiframeID AND b.extNum=d.extNum AND b.seqNum=d.seqNum AND b.seqNum>0
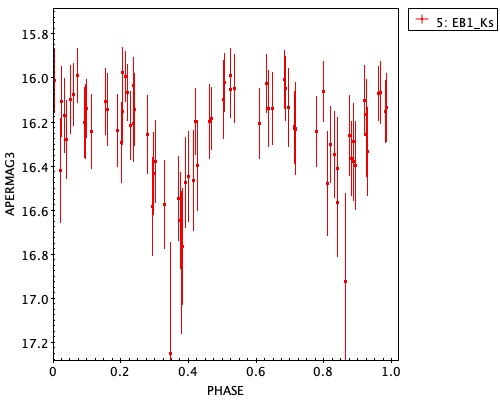
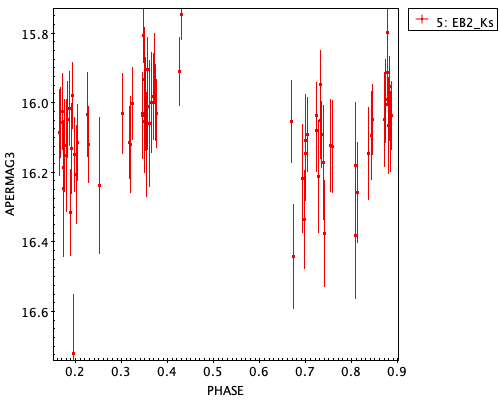
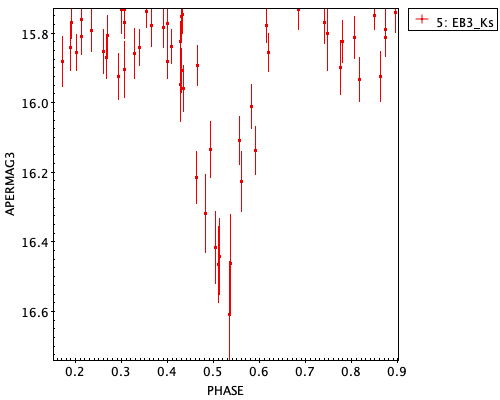
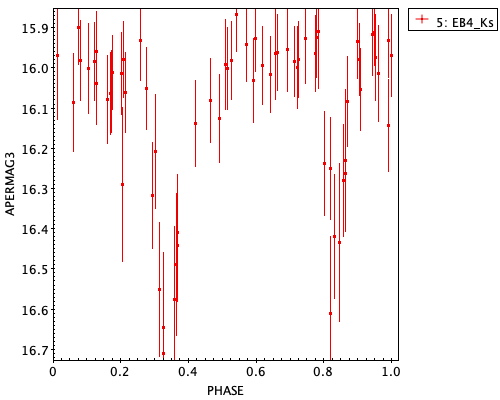
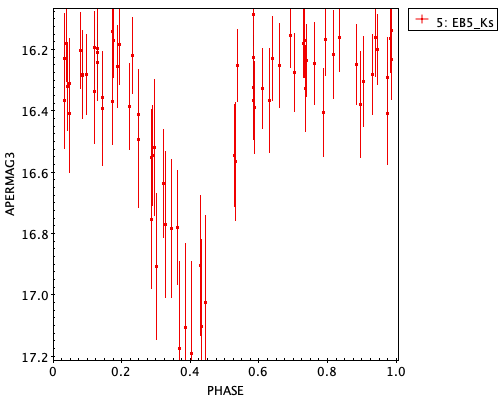
We use the following query to select the light-curves from the first 5 stars that are not cross-matched to see if they are also eclipsing binaries:
FROM vvvSourceXDetectionBestMatch AS b, Multiframe AS m,vvvDetection AS d, (SELECT top 5 v.sourceID,viva.bestPeriod FROM vvvVivaCatalogue AS viva,vvvVariability AS v WHERE v.sourceID=viva.vivaID AND bestPeriod BETWEEN 2. AND 10. AND Avar BETWEEN 0.5 AND 1.0 AND viva.nGoodMeasurements>=100 AND (v.ksmedianMag-v.ksMinMag)/(v.ksMaxMag-v.ksMinMag)<0.2 and v.ksMinMag>0. and viva.vivaID not in (select vivaID from vvvVivaXMatchCatalogue) and v.ksMeanMag>16.) AS sel
WHERE b.sourceID=sel.sourceID AND b.multiframeID=m.multiframeID AND b.multiframeID=d.multiframeID AND b.extNum=d.extNum AND b.seqNum=d.seqNum AND b.seqNum>0
We show the phase diagram (time folded on period), and 4 of them (1,3,4,5) look like classic EA/B eclipsing binaries.
Five different frequency measurement methods are used which often give different best periods, and are more or less reliable results for different variable types.
Various plots, such as Fig. 7 in Ferreira Lopes et al. 2020 show phase diagrams created using periods from a particular method rather than the best period. Below, we show how to reproduce these figures using the database and issues you need to consider.
Below, we have the lower-middle plot from Fig. 7, showing VIVA ID=515442672995, classified as a TTS in the literature, with a literature period of 8.7274 days and a VIVA LSG period of 8.6615 days. In this case the LSG period seems to give a smoother light-curve than the literature value.
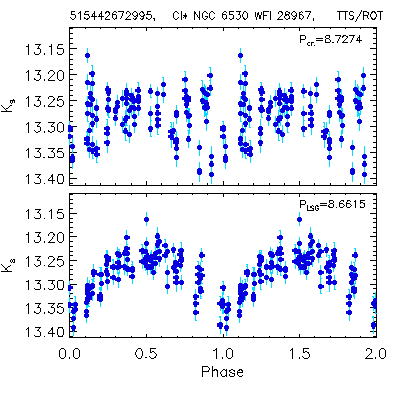
To recreate the lower panel of this plot, we need the phase, magnitude and magnitude error. A simple selection of the light-curve from VVVDR4 uses the vvvSourceXDetectionBestMatch to link to epochs and vvvDetection to get the time and magnitudes, as in numerous examples above. We can use the freqLSG to convert the mjd to a phase, remembering that this is a frequency, not a period.
FROM vvvVivaCatalogue as viva,vvvSourceXDetectionBestMatch as b,vvvDetection as d
WHERE viva.vivaID=b.sourceID AND b.multiframeID=d.multiframeID AND b.extNum=d.extNum AND b.seqNum=d.seqNum AND d.filterID=5 AND d.aperMag3>0. AND viva.vivaID=515442672995
There are two main differences between the published plot and the one generated from the archive query above. Firstly, the VIVA paper uses the pawprint data to generate the light curve, whereas the light-curves connected in VVVDR4 vvvSourceXDetectionBestMatch are tiles. While the shape of the light-curve and the range of magnitudes is the same, there are 2-3 times as many points in the VIVA paper. The other main difference is that the phase is offset. In the VIVA paper phase 0 is the minimum, whereas the simple calculation above has the minimum at a phase of 0.15.
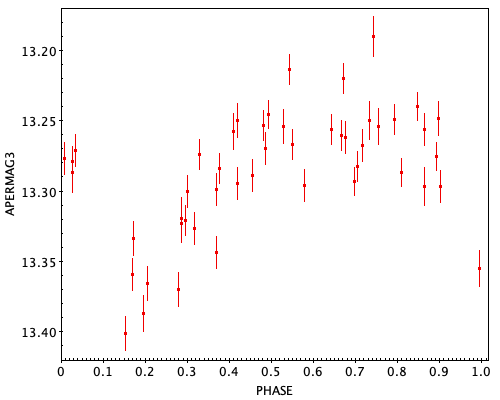
We can solve both of these issues by selecting data from VVVDR5, where light-curves are generated from pawprint data and we insert an offset of 0.15 in the calculation of phase.
FROM vvvVivaCatalogue as viva,vvvSourceXVivaCatalogue as x, vvvSourceXDetectionBestMatch as b,vvvDetection as d
WHERE viva.vivaID=x.slaveObjID AND x.masterObjID=b.sourceID AND x.distanceMins<0.03 AND x.distanceMins IN (SELECT MIN(distanceMins) FROM vvvSourceXVivaCatalogue WHERE masterObjID=x.masterObjID) AND b.multiframeID=d.multiframeID AND b.extNum=d.extNum AND b.seqNum=d.seqNum AND d.filterID=5 AND d.aperMag3>0. AND viva.vivaID=515442672995
In the case of VVVDR5, the sourceIDs do not match the vivaIDs, so we need to use the vvvSourceXVivaCatalogue neighbour table to select the nearest match that is less than 0.03 arcmin away. The resulting phase diagram is below, and looks much more like the VIVA paper.
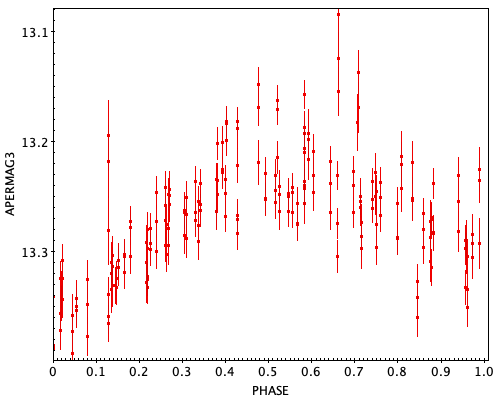
However, since VVVDR5 covers a longer time span than VVVDR4, there are more points, and in particular some of the region around phase ~0.75 and ~0.9 which were missing now have points.
We can select all of the Cepheids in the X-matched catalogue and see how the VIVA catalogue periods compare.
FROM vvvVivaCatalogue AS viva,vvvVivaXMatchCatalogue AS vxm
WHERE viva.vivaID=vxm.vivaID AND mainVarType like '%cep%'
There are 176 Cepheids altogether and 96 have a known literature period. We compare the literature and VIVA periods below:
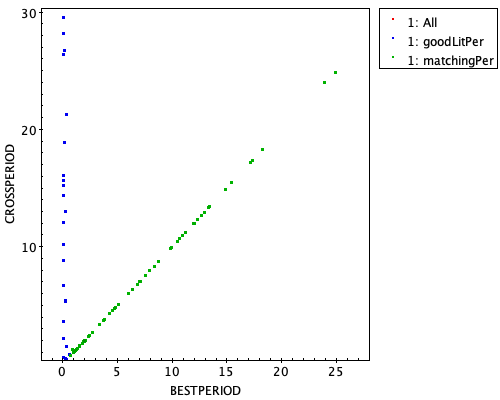
Just under 60 give very good agreement (points in green), and the other ~40 have VIVA periods well under a day, due to aliasing, too few measurements, or poor phase coverage.
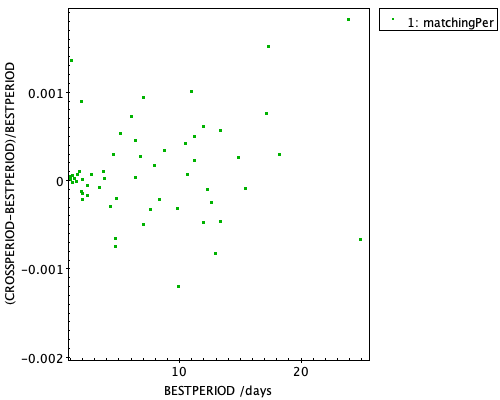
The differences between the literature and VIVA periods are extremely small for the 57 matching Cepheids: the difference in period/period < 0.002, i.e. they agree within 0.2%.
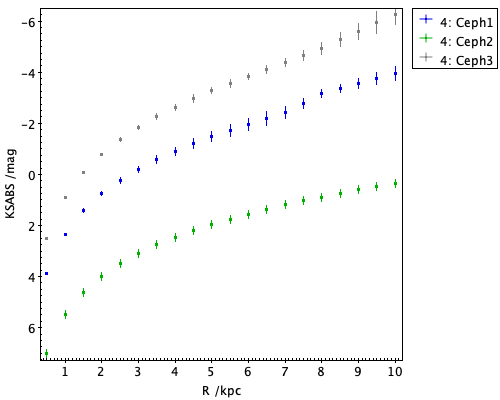
In regions where there are available 3D extinction maps, they be used to estimate the mean Ks-absolute magnitude for the star as a function of distance and these can be compared to the expected period-luminosity relationships.
FROM vvvVivaCatalogue AS viva,vvvVivaXMatchCatalogue AS vxm, vvvSourceExtinction as se, EXTINCT..vvvBulge3DExtinctVals as ext, EXTINCT..FilterExtinctionCoefficients as fc
WHERE viva.vivaID=vxm.vivaID AND mainVarType like '%cep%' and crossPeriod>0. and abs((bestPeriod-crossPeriod)/bestPeriod)<0.002 and se.sourceID=viva.vivaID and extPixelID>0 and ext.pixelID=se.extPixelID and fc.telescope like '%VISTA%' and fc.shortName='Ks' and ext.r>0.
The absolute Ks-mag vs distance for 3 different Cepheids are shown below out to 10 kpc. Extinction is a particularly important factor to consider in the Galactic Plane.
Home | Overview | Browser | Access | Login | Cookbook
Listing | FreeSQL
Links | Credits
WFAU, Institute for Astronomy, vsa-support@roe.ac.uk
Royal Observatory, Blackford Hill
Edinburgh, EH9 3HJ, UK
6/7/2020