
|
|
|
|
|
|
|
|
|
|
|
|
|
|
|
|
|
|
|
|
| |
 | |
| IFA ROE |
Flat-field correction of extracted H-alpha images
The pixel extraction form Get an Image offers the user an option ijn the pixel units selection to apply a Flat-Field (FF) correction to the H-alpha image if it is extracted in intensity space. This is done `on the fly' at the time that the area is extracted.
Determining the Flat-Field
Remember: This option can only be used with the H-alpha data pixel data extracted in Intensity space. This is the default pixel unit.The FF option is provided to enable correction for low level but large scale transmission variations that are present in the filter. These are inevitable when using an interference filter, especially one of such exceptional size. This option, which is directly analogous to application of a FF to CCD data, may prove useful when very large areas of pixel data are being extracted and/or mosaiced together and attempts are made to carefully determine the total flux in a given H-alpha emission region.
The nominal FF was obtained from averaging SuperCOSMOS scans of 3 Tech-Pan film exposures taken through the H-alpha filter with the telescope pointed at a uniformly illuminated flat white screen attached to the inside of the Dome. The illumination and exposure time were such that the exposed films had a central density putting it on the straight-line portion of the characteristic curve of the emulsion which relates incident intensity to photographic density. In this region the photographic density is linearly related to the received illumination intensity in log space. A typical tech-pan characteristic curve obtained through the standard broad-band OG590 filter is shown here as measured photographic density vs log(Intensity).
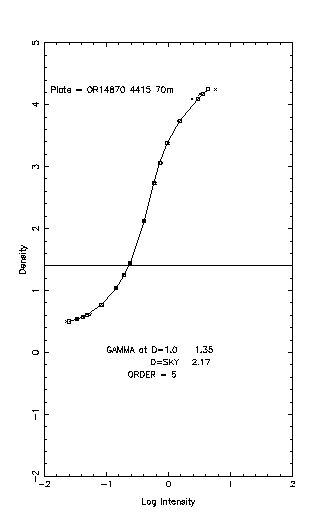
Note that for the H-alpha survey films and the FF exposures only the equivalent of 24 SCOS lanes are scanned cf 28 for standard SuperCOSMOS scans of normal survey exposures such as in the SSS. This amounts to 27648x27648 10micron pixels or 5.156x5.156degrees. The FF data was blocked by a factor 16 to give a 1728x1728 FF map for analysis purposes.
The AAO/UKST H-alpha filter
Standard broad-band filters (such as the OG590 used for the SR exposures) are highly uniform, optically flat sheets of coloured glass. The filter transmission curve is the same over the entire filter surface. In a converging beam the filter band-pass is also sufficiently broad (several hundred angstroms) that the transmitted wavelengths are not significantly affected when off axis. Hence a basically spatially invariant transmission function is seen. Unfortunately this is not the case with inteference filters.Narrow-band inteference filters, such as that employed for the AAO/UKST Galactic Plane survey, have a square glass substrate (normally a standard broad-band filter) on to which a di-electric stack of metal oxides is deposited in a circular region in a special vacuum coating plant. This region is known as the clear aperture of the filter. Several coatings are used to build up this multi-layer stack which acts as the interference filter. Although the monolithic interference filter used for the H-alpha survey is of exceptional quality, it does have low-level spatial variations in filter transmission. The clear aperture has a diameter of about 305mm (~5degrees) cf the UKST standard sized 356x356mm (6.5x6.5degree) glass substrate. Outside of this circular region the filter no longer behaves like a H-alpha inteference filter. This is why 4-degree field centres were employed with the survey to ensure contiguous H-alpha coverage between overlapping fields.
Further general details of the H-alpha filter and its specifications can be found here.
Results from the Flat-Field
The FF image obtained from the average of SuperCOSMOS scans of 3 dome flat-field exposures is shown on a linear scale here in normalised intensity space. It covers the same region as for the scanned H-alpha survey films with North to the top and East to the left. The FF map has been normalised in the sense that the base level is 1.0 (maximum intensity maximum filter transmission) and corrections for lower intensity regions than expected have values <1.0. The full range is 0.4984-1.0000 with mean:0.9307 and standard deviation: 0.0679 (6.8%). Hence, in intensity space, the FF map is a divisive correction image that is applied to restore areas of lower intensity (filter transmission) cf the filter maximum over the useful filter region. The correction breaks down towards the corners of the scanned image and in regions outside of the clear aperture. This is partly because the density of the FF exposures at the edges of the circular aperture are too low to lie on the straight line portion of the characteristic curve leading to an over correction and partly because the H-alpha band filter transmission is becoming increasingly skewed in these extreme regions.
However, over the bulk of the central region of the filter it can be seen that the filter transmission is quite uniform with only a few percent variation from centre to the edges of the clear aperture. Beyond 153mm or so from the field centre the filter response changes more rapidly as the edges of the coating are reached. The 16x blocked fits file of the average FF SCOS scan can be obtained here. Remember to use shift + mouse button 1 in Netscape and use the right mouse button + `Save target as' in Internet Explorer to download the file to your local disk space.
Despite the superb quality of the filter, there are low-level, large-scale variations in transmitted flux which can even be seen in the H-alpha survey images under certain exposure conditions. In particular there are two parallel bands of slightly enhanced transmission (leading to elevated photographic density) going E-W in the north and south of the filter. These bands are only 1-3% higher in intensity space than the surrounding regions. A histogram equalisation image of the FF map is shown here which reveals further extremely low level features in the FF. These arise from back-scattered light going through the filter and emulsion and coming back off the mandrel that sucks the film down to the UKST's curved focal surface via the circular rings scored into the mandrel's surface. These features are at the level of <0.1%. The range of 0.1-2.5% structural variations found are impressed on a more general fall off in filter transmission from centre to nominal edge which, at the very edge in the SE corner amounts to 50%. This larger scale radial transmission fall-off are also accounted for by application of the FF. Happily the biggest correction factors (20-50%) are not needed as the large degree of overlap between adjacent survey fields ensures that better data is available. Corrections in the corners are unlikely to exceed 15% (only 6% of pixels have correction factors >15% and these are all in the corners).
Apart from these large-scale parallel features and extremely low-level mandrel artefacts a contour map of filter transmission taken from the FF exposure also reveals the gradual fall off in filter transmission at greater radii from the field centre. The contour map of the FF is given here where the contours have intervals of 5%. It is clear both that the overall filter transmission map is flat tp 5% over a large fraction of the scanned region whilst also being asymmetic, i.e. more uniform out to the western edge of the scanned area and poorer at the eastern edge with as particularly poor corner in the SE. Another contour map with 2% contour intervals is shown here. At this level the North-South bars of enhanced transmission become visible.
It was with a view to correcting for these reproducible transmission variations that a FF mask has been generated. Preliminary tests indicate that it is successful at removing these artefacts from the survey data.
Once the Flat-field option is selected on the pixel-extraction web-form the current flat-field mask is applied to the data as it is being extracted. It is possible that the flat-field mask could be updated in the future. Note that the
Confidence Map
A radius of 153mm from each survey field centre has been adopted as the region within which good data (and lower, <15%, correction factors) are present. The `good data' radius from each scanned H-alpha field centre has been used in creating a confidence map which is incorporated into the extracted fits image as an addtional fits extension (extension [3], e.g test_image.fits[3]). This can be used to flag areas of the extracted image that might not be quite as good as others. Currently this has values of 100 for regions extracted interior to this radius and 0 for regions outside.Note that the IAM data is unaffected and is as derived from the image analyser on the original SuperCOSMOS scan of the H-alpha survey field.
A preliminary report on the issue of flat-fielding the H-alpha pixel data was undertaken by Dr.Robin Walker at Bristol University and is given here as a postscript file.
Home | Intro | Get an Image | Get a Catalogue
Coverage | Documentation | History | Links
WFAU, Institute for Astronomy,
Royal Observatory, Blackford Hill
Edinburgh, EH9 3HJ, UK
M.Read@roe.ac.uk
30/7/2008